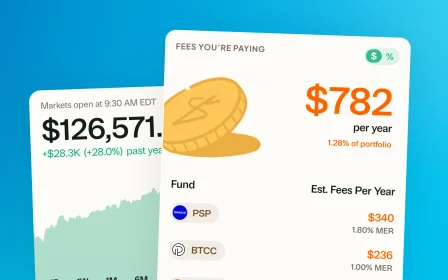
November 12, 2025 · New feature
Compare against the S&P 500, TSX, and more
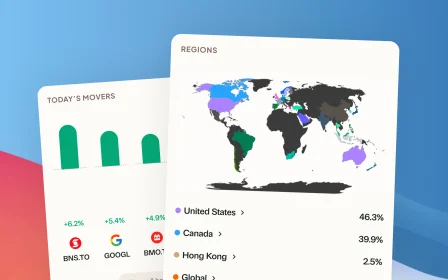
See how your portfolio, or any individual account, stacks up against popular benchmarks like the S&P 500, NASDAQ, XEQT, TSX Composite, and the Total World Index.
Ever wonder if you are too heavy in tech stocks or missing entire sectors? Or maybe you are beating the market this year, but not sure why?
Greenline just rolled out Benchmarks.
See exactly how your portfolio, or any individual account, stacks up against popular indices like the S&P 500, NASDAQ, XEQT, TSX Composite, and the Total World Index.
Benchmarks are available today, starting with Sector breakdowns. Just tap the bottom right corner to explore your results.
Want to see more comparisons by region, asset class, or returns next? Hit reply.
More updates
September 10, 2026
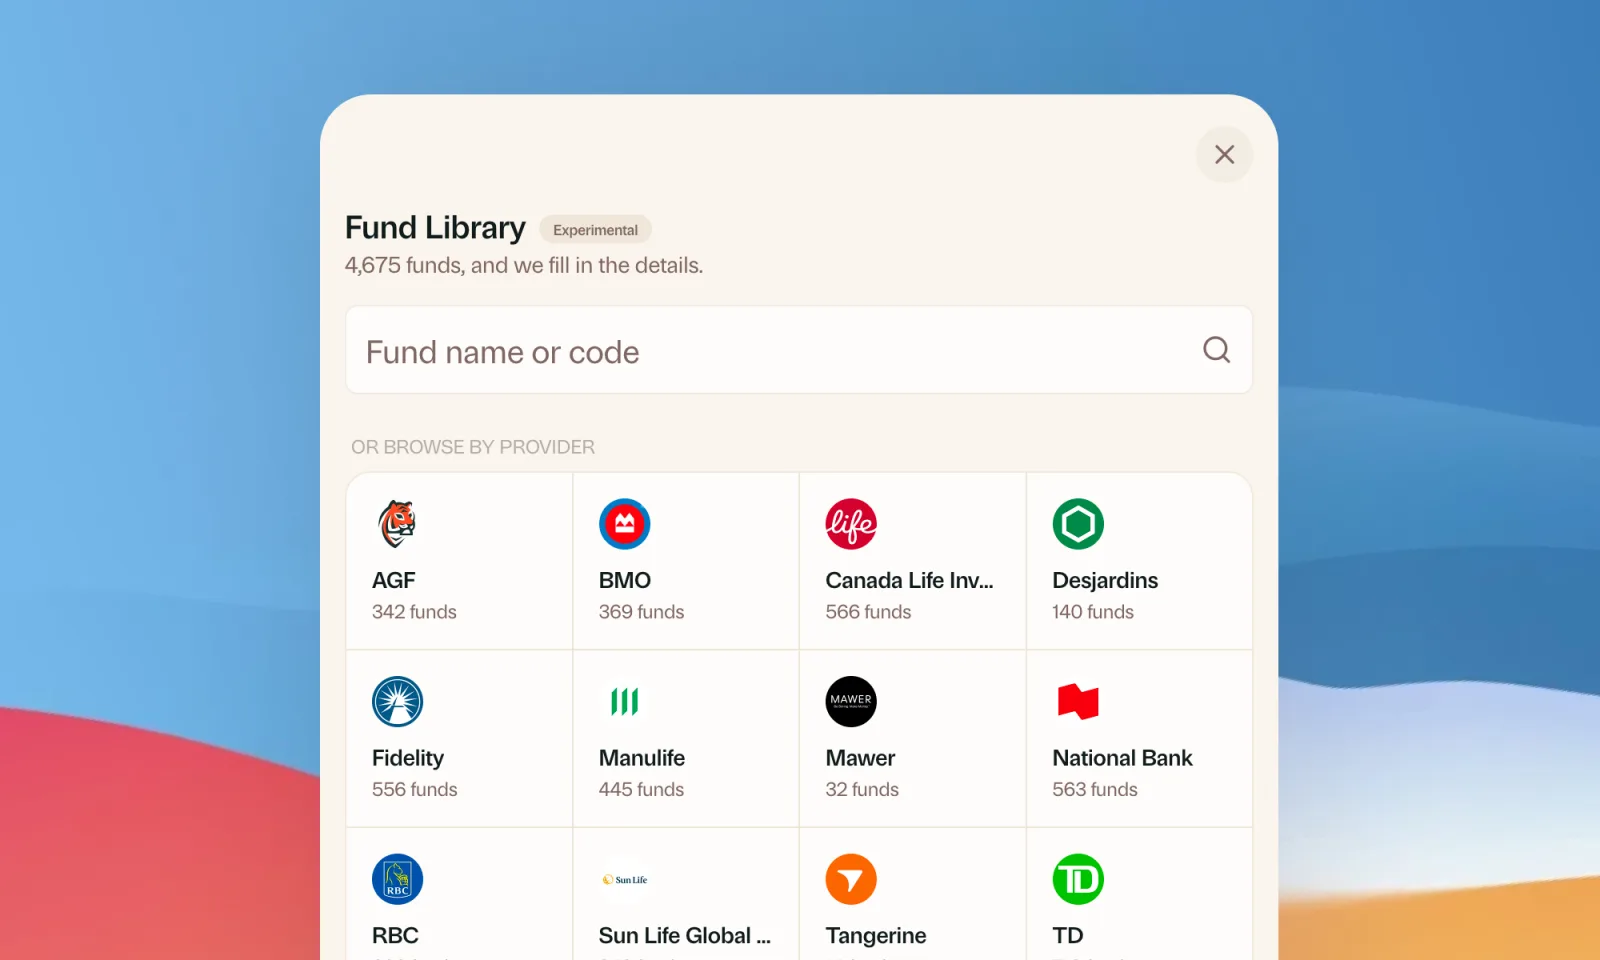
Find your mutual funds in the Fund Library
Search more than 4,500 Canadian mutual funds and get sector and region allocations, fees, and holdings filled in for you.
September 1, 2026
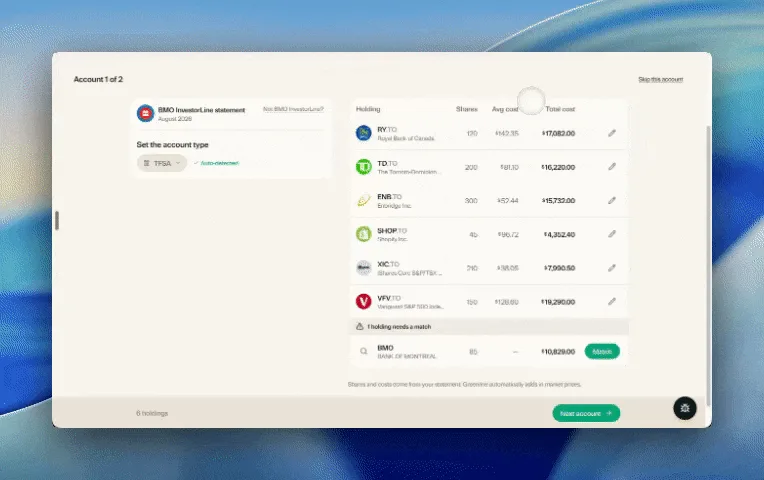
Easier imports, short tours, and sign in with any email
Fix an import yourself, update every account from one place, get a quick walkthrough when you're stuck, and sign in with any email address.

August 21, 2026
Greenline in The Globe and Mail
Andrew Galbraith at The Globe and Mail tried Greenline and wrote about it. We're honoured.
August 6, 2026
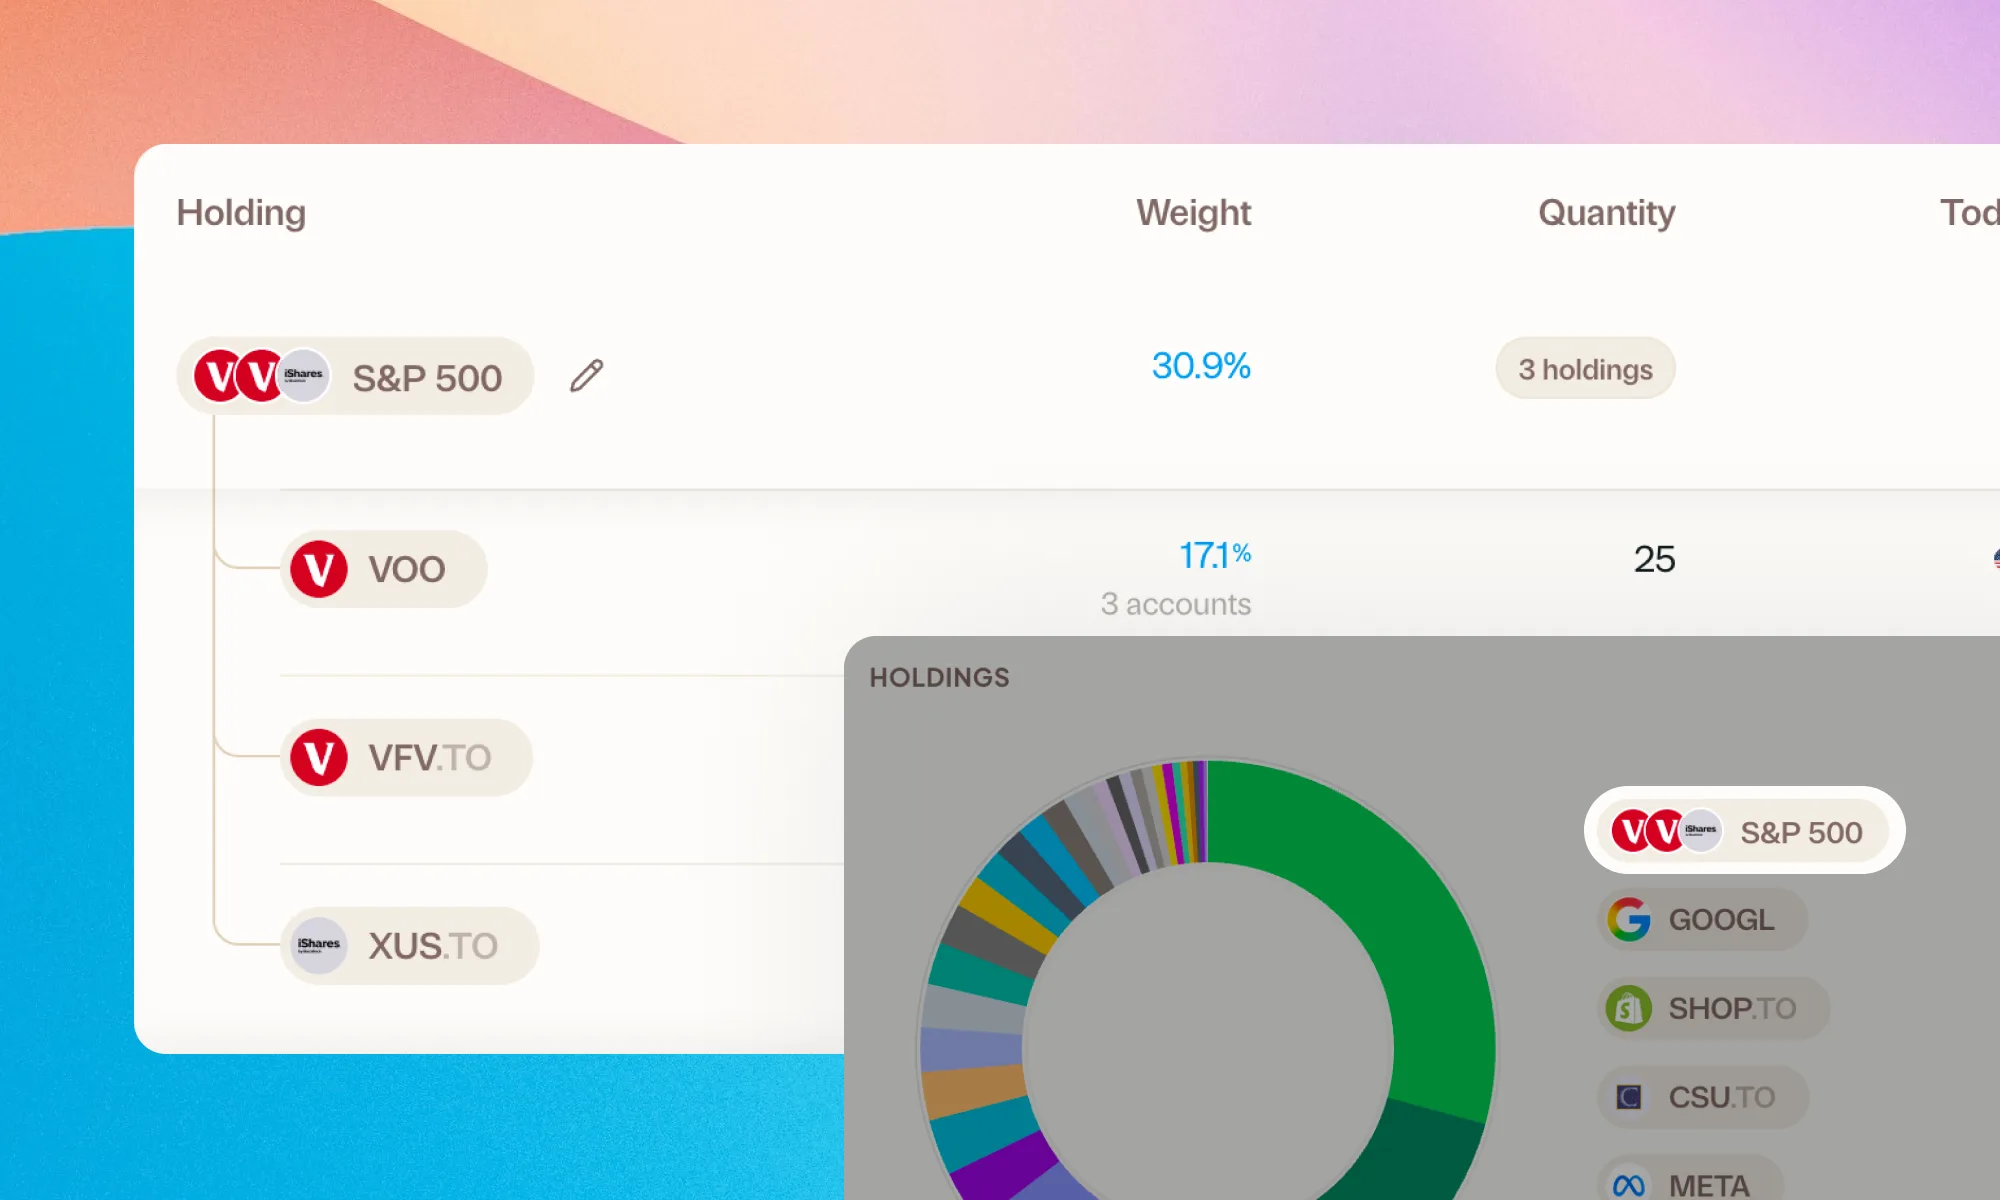
Group your holdings, however you'd like
Bundle VFV, VOO, and XUS into one S&P 500 row. Or build a Big Five banks group. Your portfolio, your groupings.