Tracking Your Portfolio Over Time
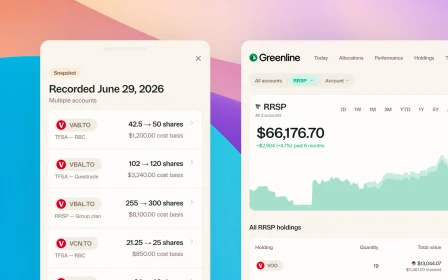
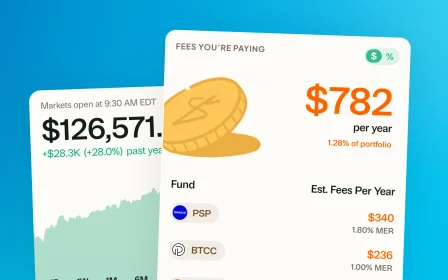
The chart at the top of your Today page is your portfolio’s history. Above it sits your total value; below it, what that value has done over the timeframe you’ve chosen.
Changing the timeframe
Tap a timeframe to redraw the chart: 1D, 1W, 1M, 6M, YTD, 1Y, 5Y or All Time.
Greenline remembers where you left it, so the chart opens on the same timeframe next time. You can change which one it opens on in Settings, under Overview and timeframes. That’s also where you choose which returns appear alongside the chart, if you like seeing two periods at once.
How far back the chart reaches depends on two things: how much history you’ve imported, and your plan. A timeframe that’s greyed out is one your plan doesn’t cover yet.
Comparing your accounts
Go to Portfolio, then Performance. The history chart there stacks your accounts by type, so you can see at a glance how much of your growth came from your TFSA against your RRSP, and how the mix has shifted.
The same page also has:
- Trends, showing which holdings moved the most and how your allocation shifted over a quarter or year to date.
- Quarterly performance and annual growth, for a longer view.
- Best days and records, for the outliers.
A note on early days
If you’ve only just started, the chart begins the day your data does. A short line isn’t a bug, it’s the honest picture. It fills in as you import more history.
Still need help? Reach out at support@usegreenline.com.
Still having trouble?
Reach out and we'll help you get set up. We usually reply within a day.
Email support@usegreenline.com