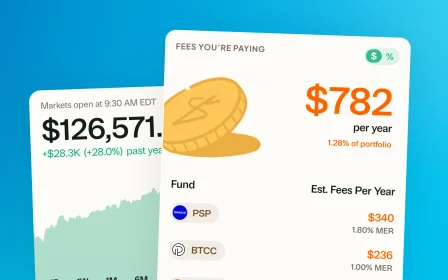
August 1, 2026 · Design
The portfolio chart got a glow-up
Dynamic colour, smoother animations, and new chart options like high/low markers and an on-chart value scale.
The chart you look at most just got the most attention.
Your portfolio’s overview chart has been redrawn with a dynamic colour treatment that shifts with your chart, and animations that glide between time periods instead of snapping. Switch from one month to one year and the chart zooms through the change, so you can feel how the new window relates to the old one.
New options, if you want them
Two additions you can switch on:
- High/Low markers. See exactly where your portfolio peaked and dipped in the period you’re looking at.
- Value scale. Prefer numbers on the chart itself? Turn on the scale and the chart shows values along the side.
Both live in the chart’s ⋮ menu, along with the rest of the chart options. The menu also moved off the chart itself, so nothing covers your line.
Calmer numbers everywhere
Alongside the chart, the numbers across Greenline got quieter. Dollar signs, cents, and percent signs now step back so the figures that matter stand out. You may not notice it consciously. That’s the point.
More updates
September 10, 2026
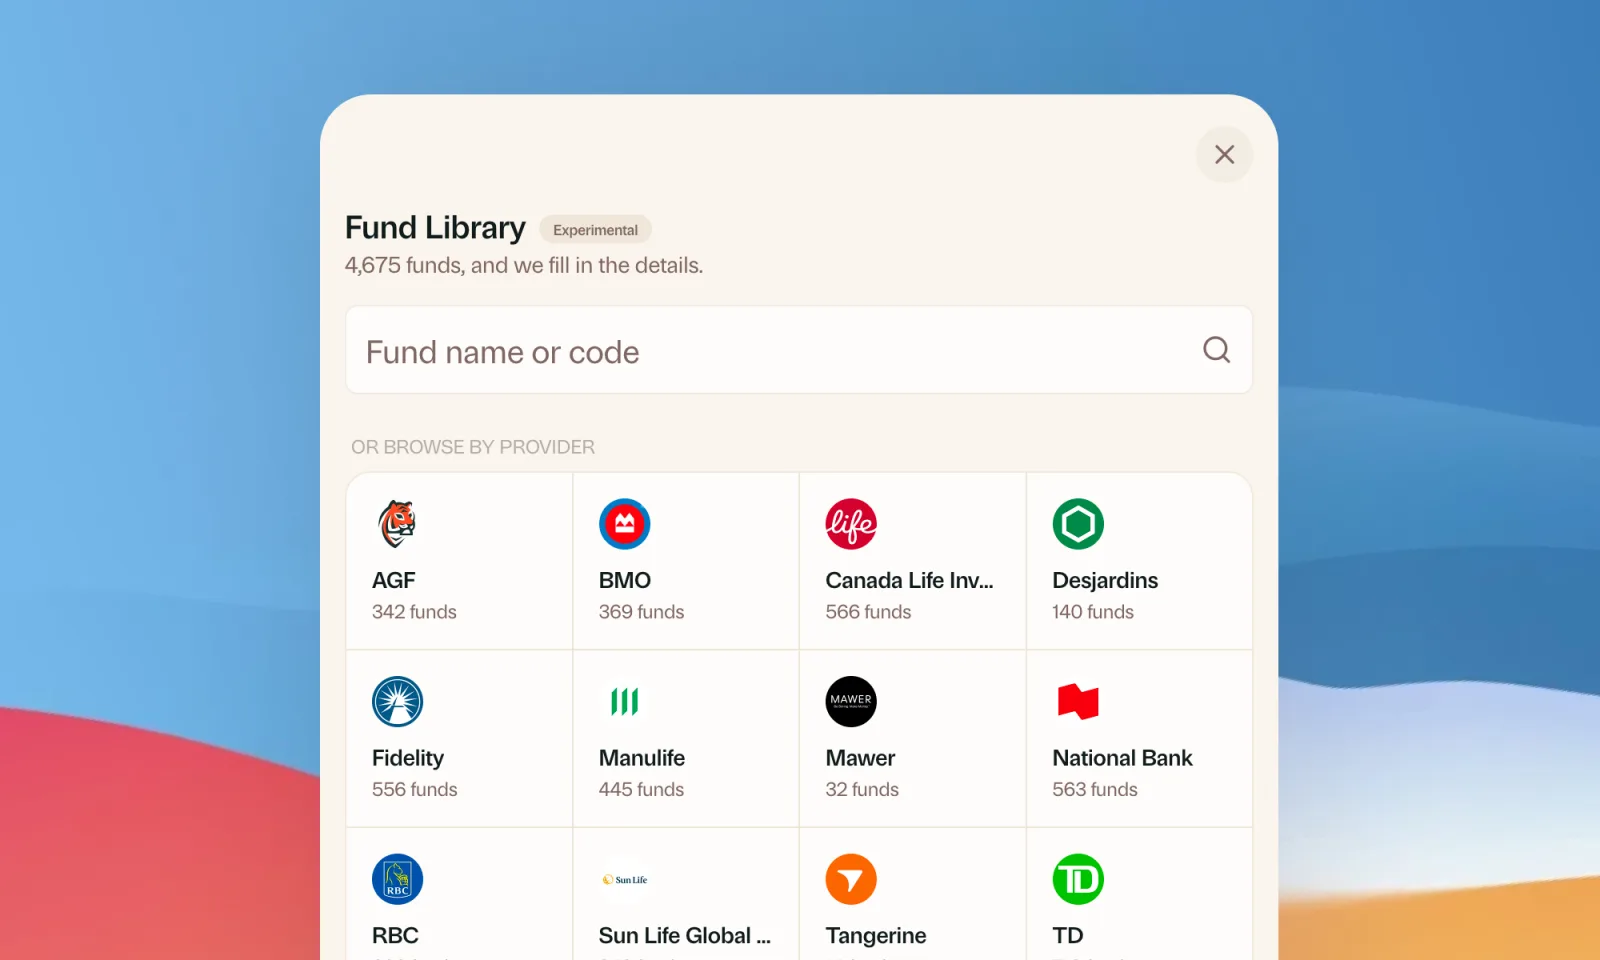
Find your mutual funds in the Fund Library
Search more than 4,500 Canadian mutual funds and get sector and region allocations, fees, and holdings filled in for you.
September 1, 2026
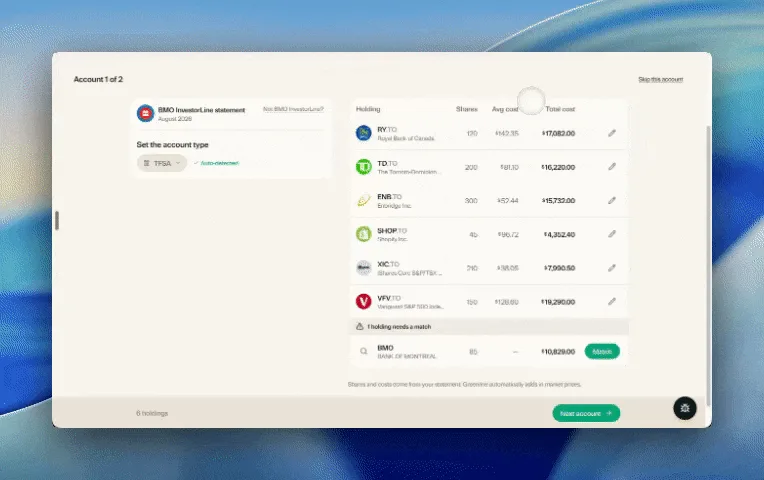
Easier imports, short tours, and sign in with any email
Fix an import yourself, update every account from one place, get a quick walkthrough when you're stuck, and sign in with any email address.

August 21, 2026
Greenline in The Globe and Mail
Andrew Galbraith at The Globe and Mail tried Greenline and wrote about it. We're honoured.
August 6, 2026
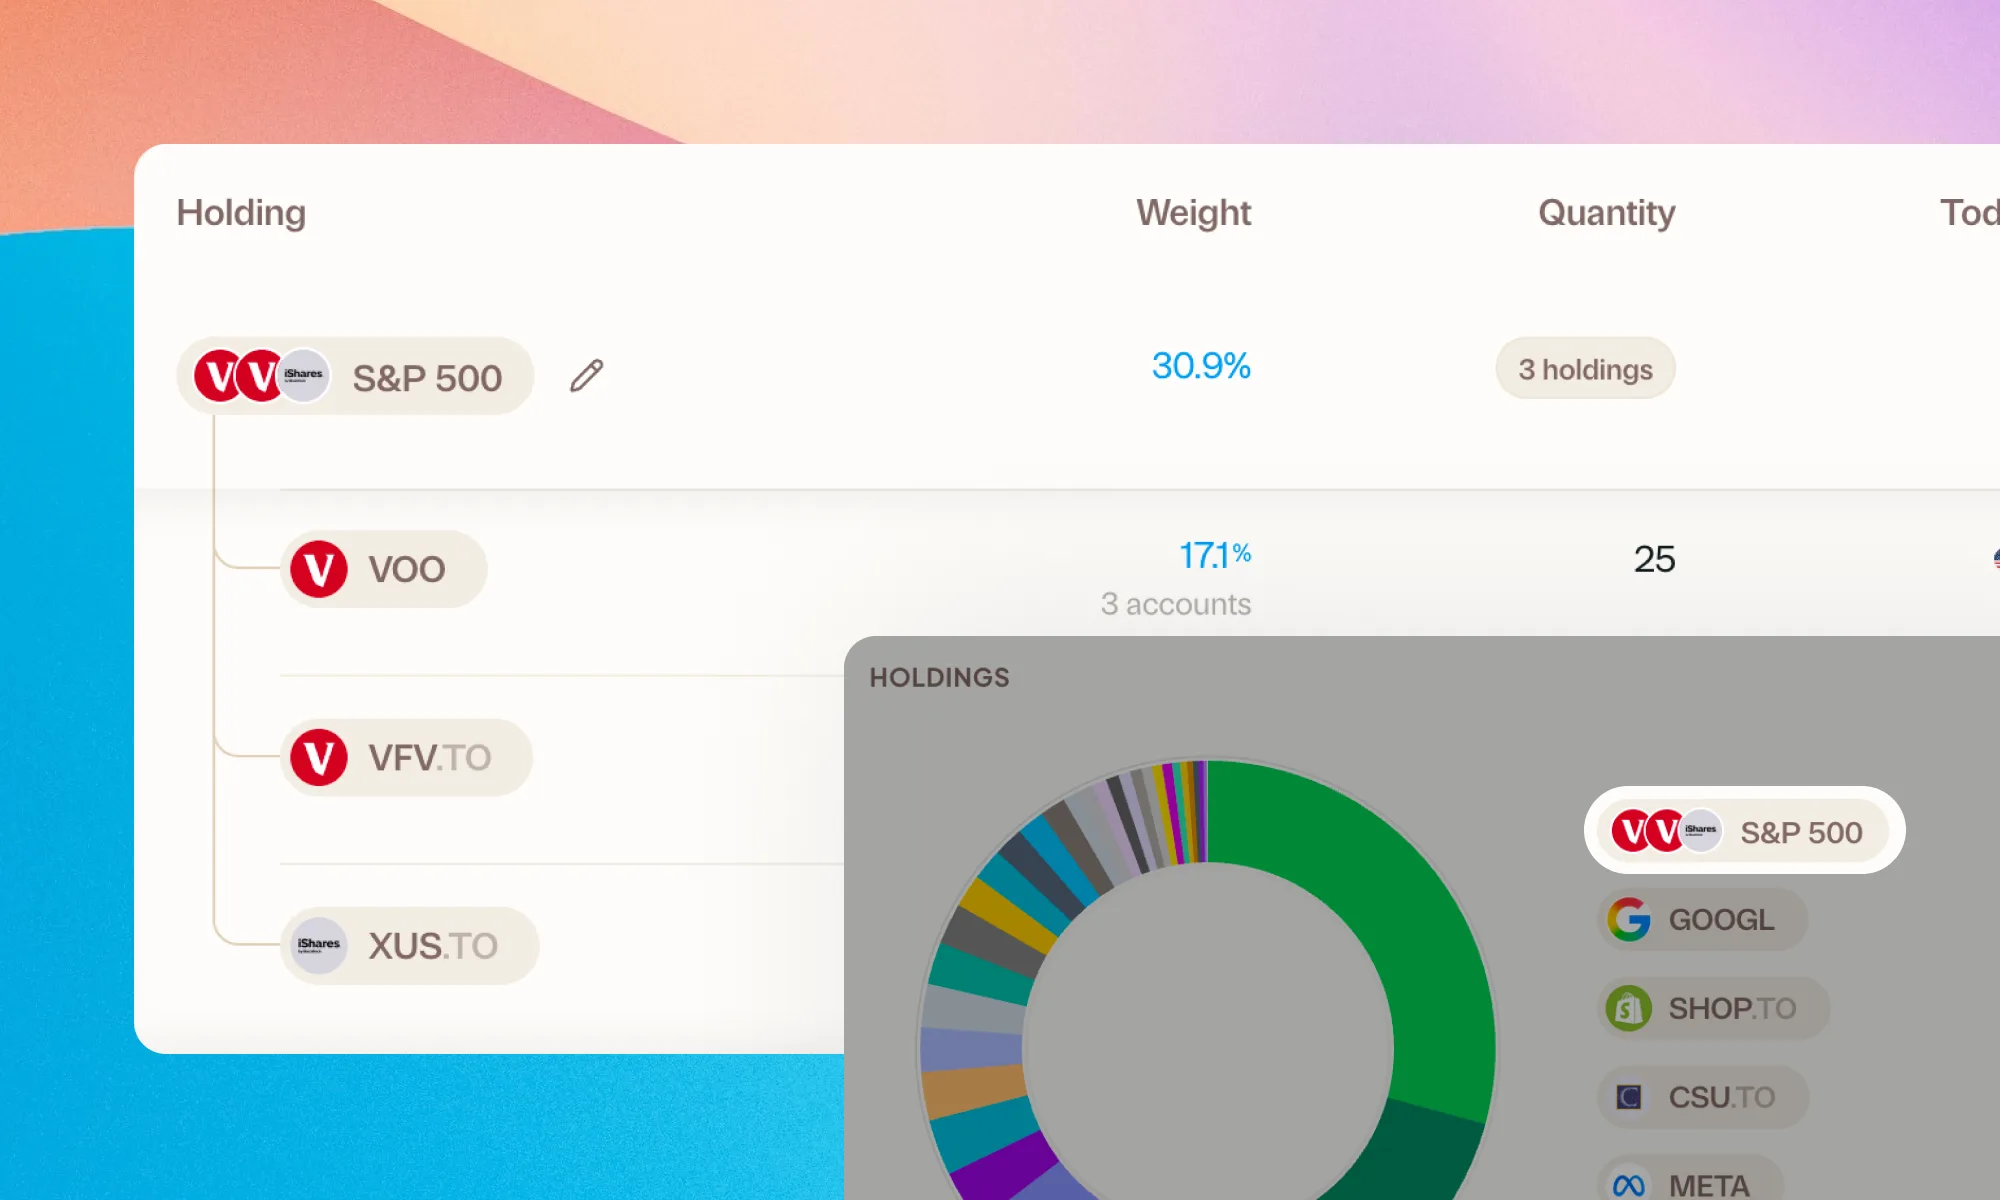
Group your holdings, however you'd like
Bundle VFV, VOO, and XUS into one S&P 500 row. Or build a Big Five banks group. Your portfolio, your groupings.